


Original Article - Year 2025 - Volume 40Issue 1
Comprehensive Evaluation of Facial Aesthetics after Rhytidectomy
Avaliação abrangente da estética facial após ritidoplastia
Gabriel Neves dos Santos Mosqueira Gomes1, ; Ana Beatriz Gomes de Almeida1; Henrique Antonio Laviano Agrelo1; Isttayner Martins Magalhães1; Ivan Demolinari de Miranda1
ABSTRACT
Introduction The advancement in technologies applied to facial rejuvenation provides increasingly promising aesthetic outcomes. Although the therapeutic arsenal is growing,we need amore comprehensive study of quantitative and qualitative variables on the long-term outcomes of rhytidectomy associated or not with supplementary procedures. The present study retrospectively assessed rhytidectomy surgeries performed in a reference center.
Materials and Methods We evaluated the photographic record of patients operated on from 2021 to 2022 using Crisalix (Crisalix S.A.), Facetool, and FaceTag (Minical, Inc.) software to obtain quantitative values of symmetrization, proportion, and volumization. To assess qualitative variables, we applied the Facial Assessment and Cosmetic Enhancement Quality of Life Questionnaire (FACE-Q) to patients and an expert professional. We compared the qualitative variables from the questionnaires (translated into Rasch tables) with quantitative variables provided by the software to confirm their level of correlation.
Results We found that although different tools evaluated the same parameters (the symmetry and volume of key anatomical points in facial rejuvenation), the weight of these parameters is smaller than the final absolute value of each processing. Linear regression revealed no statistically significant correlation between values. During the study, different variables were identified that hinder the interface with technologies and questionnaires.
Conclusion We concluded that determining a single postoperative evaluation parameter correlated with an expert assessment was not feasible in our sample.
Keywords: cohort studies; facial asymmetry; rhytidoplasty; software; surgery; plastic
RESUMO
Introdução O avanço das tecnologias aplicadas ao rejuvenescimento facial proporciona resultados estéticos cada vez mais promissores. Embora estejamos vivenciando um crescente aumento no arsenal terapêutico, os resultados no longo prazo de ritidoplastias associadas ou não a procedimentos complementares carecem de um estudo mais abrangente focado em variáveis tanto quantitativas quanto qualitativas. O estudo propõe avaliar retrospectivamente as cirurgias de ritidoplastia realizadas em centro de referência.
Materiais e Métodos Avaliamos o registro fotográfico de pacientes operadas entre 2021 e 2022 com os softwares Crisalix (Crisalix S.A.), Facetool e FaceTag (Minical, Inc.) para obter valores quantitativos de simetrização, proporções e volumização e avaliamos qualitativamente com questionários referentes ao Facial Assessment and Cosmetic Enhancement Quality of Life Questionnaire (FACE-Q) aplicados aos pacientes e um especialista na área. Comparamos as variáveis qualitativas dos questionários traduzidas pelas tabelas Rasch com as variáveis quantitativas obtidas com os softwares para confirmar o nível de correlação entre as mesmas.
Resultados Encontramos que embora os mesmos parâmetros sejam avaliados pelas diferentes ferramentas (simetria e volumização de pontos anatômicos chave no rejuvenescimento facial), o peso desses parâmetros é pequeno quando se obtém o valor absoluto final de cada processamento. Tais valores demonstraram não possuir correlação estatística entre eles após serem submetidos a regressão linear. Destacam-se também diferentes variáveis identificadas durante o estudo que prejudicam a interface com as tecnologias e questionários.
Conclusão Conclui-se que determinar um parâmetro único de avaliação do pós-operatório que seja correlato com a avaliação de um especialista não foi possível na amostra estudada.
Palavras-chave: assimetria facial; cirurgia plástica; estudos de coortes; ritidoplastia; software
Introduction
Although the concept of aging evokes the notion of advanced age, its biological process begins at birth, becoming more prominent during adulthood due to changes in skin quality, tissue ptosis, and volumetric depletion from bone reabsorption.1 In different cultures and historical moments, aging marks were symbols of experience and respect. Today, especially after the advances in plastic surgery techniques, aging marks have been considered increasingly undesirable and often stigmatizing.1–3 The demand for aesthetic procedures to delay the appearance or treat signs of aging has grown, resulting in the emergence of new strategies and technologies to meet such demand.2
Even though the growing increase in the therapeutic arsenal for treating rhytids, skin quality, or ptotic facial structure positioning follows the demand according to technological evolution, scientific advancement in this area still lacks relevant levels of evidence.2
The lack of quality scientific evidence for a comparative evaluation of these new technologies or techniques for approaching the superficial musculoaponeurotic system (SMAS) leads doctors to focus on offering their treatment to the detriment of better understanding of the meaning of beauty and the motivation of their patients to restore or achieve such beauty.3 The philosophical, artistic, and scientific fields debated the definition of beauty but with no precise description or required standardization. The challenge of studying this subject is understandable due to the inherent limitations of plastic surgery. Some factors, including ethnicity, symmetry, and the interface with new technologies, are natural barriers to the quantitative evaluation of beauty.3
Software assessment of facial landmarks in 3 (3D) or 2 dimensions (2D) has generated a new commercial demand for doctors’ offices. Today, although the software has not shown improvements in procedure quality or patient satisfaction, it seems that this tool only increases the surgery conversion rate.4 It is worth highlighting the lack of a current standardized or ideal evaluation methodology in 2D or 3D in the public domain.
Another area still little studied and equally challenging to understand is the medical judicialization in Brazil. As in other countries, medical judicialization has been growing significantly, mostly in surgical centers.5 Few low-evidence studies analyzed the impact of 2D or 3D facial assessment on legal action rates. However, it is common sense that the more informed the patient is about the procedure, the lower the chance of legal action.5,6 In this current scenario, it would be interesting to study and create validated tools to objectively quantify the surgical success of plastic surgeries instead of relying on the subjective evaluation of other professionals not directly involvement in each facial rejuvenation process.
Objective
The present study aims to retrospectively evaluate outcomes from rhytidoplasty surgeries performed from 2021 to 2022 in the plastic surgery service of Hospital Federal dos Servidores do Estado (HFSE), Rio de Janeiro, Brazil, by comparing the combined use of software and questionnaires with the opinions of expert surgeons.
Materials and Methods
This retrospective cohort, an epidemiological observational study with previous data collection, selected all patients who underwent facial surgeries at the hospital from 2021 to 2022 (n = 122). Next, we selected patients who underwent rhytidectomy using the modified Baker technique (superficial musculoaponeurotic system [SMAS] plication) with no associated blepharoplasty or fat grafting (n = 48). We excluded patients unavailable for contact or who failed or refused to sign the informed consent form, leaving 16 subjects. Of these patients, we excluded 6 who did not have a photographic record accepted by the minimum software settings or within the appropriate postoperative time, that is, preoperative and 6-month postoperative photos with similar lighting and incidence. Thus, this evaluation included 10 patients.
Preand postoperative photographic record analysis used Facetool, FaceTag (Minical, Inc.), and Crisalix (Crisalix S.A.) software. The software measured anatomical points classically associated with golden proportion, symmetry, and volumization.
The FaceTag software evaluated the symmetry between anatomical points and compared points according to the golden ratio. It also calculated point relationships, generating an equivalent qualitative assessment ranging from 0 to 100.
The Facetool software confirmed the key anatomical landmarks used in the FaceTag software to determine the accuracy in measuring the relationships between two different points in the same photograph.
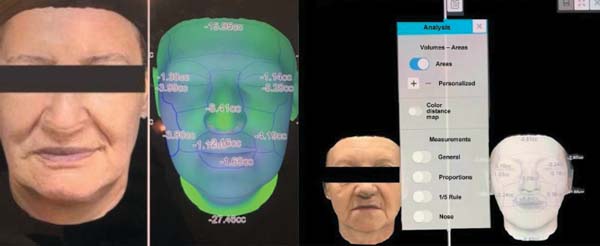
The Crisalix software assessed facial volumization alone in the presumably positive and negative areas of the face, along with their postoperative modification (►Fig. 1).

We contacted patients to sign the informed consent form and answer questionnaires regarding their overall satisfaction with the outcome, including a qualitative assessment, a visual age perception scale, and satisfaction with the decision to undergo surgery. We converted the qualitative responses into Rasch tables to quantitative scores ranging from 0 to 100.
An expert surgeon with over 10 years of experience in rhytidoplasty, a reference in the field, analyzed preoperative and postoperative photographs. This surgeon had no conflicts of interest with the proposing institution and completed the Facial Assessment and Cosmetic Enhancement Quality of Life Questionnaire (FACE-Q) scores regarding general satisfaction and visual age perception. We grouped the FACE-Q answers for each patient and paired them with the evaluator’s responses.
The expert’s FACE-Q overall assessment, the patient’s FACE-Q age and overall evaluations, and the final FaceTag software assessment balance underwent linear regression with the expert assessment as the dependent variable.
The ethics committee/study center of HFSE approved the present study, which is in Plataforma Brasil under registration number 73878523.4.0000.5252.
Results
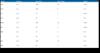
The patients’ results ranged from 71 to 87, with a mean value of ~ 77 of the FaceTag software coefficient (►Table 1). The software evaluated the ratios between the middle and lower thirds, the relationship between the width and height of the middle and upper thirds, the width of the jaw about the face, the distance between the medial corners and the facial width, the height and length of the eyes, the positioning of the eyebrows, and the relationship between the philtrum and the jaw.
| Preop FaceTag | Postop FaceTag | FaceTag balance | Expert balance | Preop expert | Postop expert | Age expert | |
|---|---|---|---|---|---|---|---|
| CSS | 76 | 79 | 3 | (+20) | 40 | 60 | 10 |
| CDS | 79 | 78 | -1 | (+5) | 50 | 55 | 0 |
| CG | 86 | 87 | 1 | (+10) | 40 | 50 | 3 |
| ELA | 75 | 77 | 2 | (+5) | 40 | 45 | 0 |
| MDO | 82 | 75 | -7 | (+20) | 60 | 80 | 0 |
| SB | 78 | 81 | 3 | (+20) | 40 | 60 | 2 |
| MJF | 75 | 72 | -3 | (+5) | 40 | 45 | 0 |
| L | 73 | 71 | -1 | (+5) | 40 | 45 | 0 |
| ZM | 72 | 78 | 4 | (+5) | 50 | 55 | 0 |
| TPP | 71 | 74 | 3 | (+10) | 40 | 50 | 5 |
| Mean: 76.700 | Mean: 77.200 | Mean: 0.4 | Mean: 0.8 | Mean: 44 | Mean: 54.5 | ||
| SD = 4.667 | SD: 4.661 | SD: 3.438 |
This software compared facial relations with the golden ratio, and the patient’s facial symmetry indicated a significant increase in these parameters, that is, surgery resulted in higher symmetry, closer to the ideal proportion. Numerically, mean values were 76.7 before and 77.2 after surgery.
Individually, the difference between the final and initial scores ranged from -7 to 4, with a mean value of 4. Overall, the mean increased 0.4 points from the preoperative to the postoperative periods (►Table 1).
Regarding facial volumization areas, we selected the Crisalix software to evaluate the positive and negative areas of the face and their degree of postoperative modification. ►Tables 2–4 summarize the findings on the malar, masseteric, and periorbital regions, respectively. It is worth highlighting that this analysis assessed nine patients. One subject did not present the required conditions and participated in other metrics.
| Crisalix | Malar (right) | Malar (left) | Difference | Percentual difference |
|---|---|---|---|---|
| ELA | -232 | -294 | -062 | +26% |
| MDO | -386 | -345 | 041 | -10% |
| SB | -028 | -086 | -058 | +207% |
| MJF | -082 | -216 | -134 | -163% |
| L | 260 | 340 | 08 | +30% |
| ZM | -38 | -41 | -03 | +789% |
| TPP | 450 | 270 | -18 | -40% |
| CDS | -024 | 036 | 06 | +250% |
| CG | -15 | -26 | -11 | -73% |

| Crisalix | Masseteric region (right) | Masseteric region (left) | Difference | Percentual difference |
|---|---|---|---|---|
| ELA | -721 | -879 | -158 | +2,191% |
| MDO | -743 | -485 | 258 | -34.72% |
| SB | -189 | 085 | 274 | +14,497% |
| MJF | -589 | -344 | 245 | -41.59% |
| L | 589 | 360 | -229 | -38.87% |
| ZM | -49 | -38 | 11 | -22.44% |
| TPP | 630 | 490 | -140 | -22.22% |
| CDS | -199 | -085 | 114 | -57.28% |
| CG | -32 | -55 | -23 | -71.87% |

| Crisalix | Periorbital region (right) | Periorbital region (left) | Difference | Percentual difference |
|---|---|---|---|---|
| ELA | -252 | -207 | 045 | -1,785% |
| MDO | -460 | -432 | 028 | -6.08% |
| SB | -101 | -109 | -008 | +792% |
| MJF | -034 | -177 | -143 | +42,058% |
| L | 434 | 420 | -014 | -322% |
| ZM | -39 | -52 | -13 | +3,333% |
| TPP | 480 | 320 | -16 | -3,333% |
| CDS | -103 | -018 | 085 | -8,252% |
| CG | -34 | -24 | 10 | -2,941% |

These initial results demonstrate a significant variation between patients, reinforcing our premises on conceptualized symmetrization metrics combined with symmetrization in a single subject. For the malar region, the changes between the 2 sides of the face after surgery range from 7.89 (equation relating the postoperative difference to the preoperative value) to 250%. In the masseter, the variation was from 21.91 to 144.97%. In the periorbital region, the minimum and maximum percentage differences were 3.22 and 420.58%. Thus, this region simultaneously had the smallest and largest variation.
Despite the large value range, these results are not significant; therefore, they do not determine facial asymmetries. In a T-test model analysis, the p-value, which reflects the statistical relevance of the data, was higher than 0.25, indicating low significance. Moreover, volumization assessment is complex and, as it relies on photographic processing, it is subject to variables that influence the outcome.
In this context, it is worth discussing in greater depth some images used for volumization evaluation by the Crisalix software. Since the present study had 10 patients, we selected 2 as representatives of the group to allow a more detailed analysis.
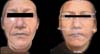
►Fig. 2 compares the outcomes in the 56-year-old patient, MDO, before and after surgery. The image demonstrates the symmetry achieved by the procedure. Reinforcing these findings, the analysis indicated excellent symmetry (►Table 5).
| MDO | |
|---|---|
| Malar region (right) | -386 |
| Malar region (left) | -345 |
| Difference (malar region) | 041 |
| Percentual difference (malar region) | -10% |
| Masseteric region (right) | -743 |
| Masseteric region (left) | -485 |
| Difference (masseteric region) | 258 |
| Percentual difference (masseteric region) | -34.72% |
| Periorbital region (right) | -460 |
| Periorbital region (left) | -432 |
| Difference (periorbital region) | 028 |
| Percentual difference (periorbital region) | -6.08% |

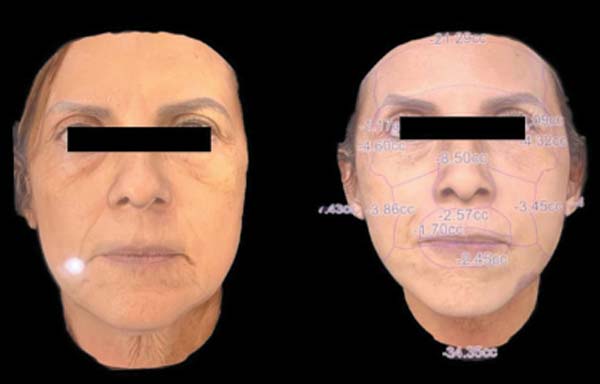

Percentage data ranged from 6 to 34%, with a mean value of 16.93, indicating symmetry. In addition, to reinforce this finding, the masseteric region, the site with the greatest discrepancy, did not present differences visible to the naked eye (►Fig. 2).
The patient ELA, 64-year-old, had satisfactory symmetrization outcomes, while MDO had good outcomes (►Fig. 3). For ELA, the software’s absolute results were usually higher compared with MDO. However, the mean percentage values of -26%, 21.91%, and 17.85%, are not so far apart, corresponding to 21.92%.
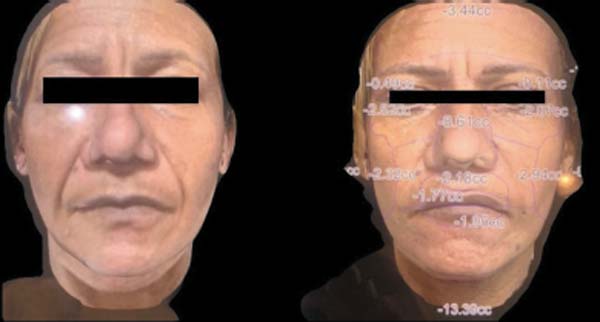
It is worth noting that this patient is older than the first; even so, she presented satisfactory symmetrization outcomes, with no visible asymmetries (►Table 6).
| ELA | |
|---|---|
| Malar region (right) | -232 |
| Malar region (left) | -294 |
| Difference (malar region) | -062 |
| Percentual difference (malar region) | +26% |
| Masseteric region (right) | -721 |
| Masseteric region (left) | -879 |
| Difference (masseteric region) | -158 |
| Percentual difference (masseteric region) | +2,191% |
| Periorbital region (right) | -252 |
| Periorbital region (left) | -207 |
| Difference (periorbital region) | 045 |
| Percentual difference (periorbital region) | -1,785% |

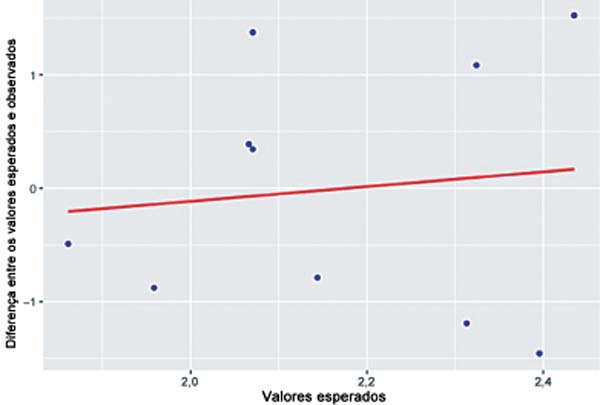
We evaluated the data using linear regression to compare the results from questionnaires, the software, and the examiner. This model allows inferences based on previous information. Integrated data processing revealed that, in a simplified way, the results were not comparable.
In the present analysis, the dependent variable was the expert’s assessment. As the software, patient-related FACEQ, and age-related FACE-Q results were independent variables, this is a multi-modal regression model (►Table 7).
| Patient | Software | Face-Q-O | Face-Q-Age | Expert |
|---|---|---|---|---|
| CSS | (+3) | 100 | 10 | (+20) |
| CDS | (-1) | 100 | 8 | (+5) |
| CG | (+1) | 79 | 3 | (+10) |
| ELA | (+2) | 87 | 7 | (+5) |
| MDO | (-7) | 100 | 10 | (+20) |
| SB | (+3) | 82 | 5 | (+20) |
| MJF | (-3) | 72 | 5 | (+5) |
| L | (-1) | 64 | 0 | (+5) |
| ZM | (+4) | 100 | 10 | (+5) |
| TPP | (+3) | 82 | 5 | (+10) |
Abbreviations: FACE-Q, Facial Assessment and Cosmetic Enhancement Quality of Life Questionnaire; Face-Q-O, FACE-Q overall assessment. Note: The first column shows the patients, and the next three columns correspond to the independent variables. The last column refers to the expert’s evaluation, that is, the dependent variable.
The equation was lm(formula = log.expert ~ software + face q-o + face q-age, data = data), in which “lm” indicates the modal regression model, “log.expert” is the logarithm value of the dependent variable (expert’s assessment), and the symbol ~ separates the dependent variable from the independent variables, as the first is a function of the second. In F-statistics, the predictive power of the independent variables was 0.2029. In an independent analysis, the p-value was 0.8907, denoting little statistical significance.
The results of FACE-Q ranged from 64 to 100, with a mean value of 86.6. Mode, that is, the most frequent value in a set, was 100, indicating significant patient satisfaction.
However, there was no correspondence between the individual sensations of the patients, the software findings, and the expert’s assessment (►Fig. 4). To simplify the statistical analysis, ►Table 7 shows the residual values, the difference between the expected and observed values (standard residuals), and the expected (fitted) values. The table demonstrates that the observed values are not close to the expected ones.
Discussion
The initial planning for any facial aesthetic procedure requires a thorough 3D evaluation of the changes in the different layers of the face.7 We believe that software for assessing facial symmetry and volumization helps the surgical planning process. This tool may improve interaction with patients regarding areas with the greatest therapeutic requirements or asymmetry points feasible for surgical correction, facilitating their discussion. However, its role in postoperative assessment remains poorly understood and there is controversy about whether its results are enough to argue for a minimally satisfactory outcome after the procedure.
Facial rejuvenation evaluation considers many anatomical points to infer success, including volumization and malar projection.8 In addition, studies demonstrated the current possibility of assessing preoperative and postoperative volumization differences with software using 3D stereophotogrammetry. In the present study, the areas requiring volumization to obtain a certain level of rejuvenation were the forehead, the temple, and the malar region. It is also worth highlighting areas presenting a negative postoperative balance, such as the nasolabial fold, thee marionette line, and the submental region.9
To assess satisfaction with facial aesthetic procedures, it is essential to standardize a comprehensive qualitative evaluation and use quantitative parameters to compare variables provided by software or experts. Different studies with similar proposals, including the HARMONY study, used the FACE-Q.10 This questionnaire has been adapted and translated into Portuguese. It has several segments specifically addressing patient satisfaction with each outcome aspect during the follow-up week.10
According to the latest meta-analysis on recent recurrences after rhytidoplasty, the mean rate is 2.4% within 2 years after the procedure. As such, FACE-Q assessment must occur 1 year after surgery, when the current appearance of most patients will be a result of the surgery.11
The satisfaction results in the overall FACE-Q evaluation, although higher than the expert’s assessment, had no statistical correlation nor the same correlation with the variables from the software. The lack of correlation between evaluations may result from multiple sources of error, as the present study refers to perceptions. The outcomes from combining fat grafting with rhytidectomy tend to be superior in terms of rejuvenation. The procedure is safe, just like other combinations.12 Even though our patients underwent rhytidoplasty alone, without any associated procedures, the expert’s perception, who already witnessed and obtained aesthetically-superior outcomes compared with this sample, may be underestimated.
It is worth highlighting the time between the photographic record and the satisfaction assessment using the questionnaire, which was at least 6 months (photographs were taken 6 months after the procedure). In addition, it is worth emphasizing that the light incidence (as photographs were taken in different environments) and the difference in muscle tone interfered with the expert’s assessment, making photographic analysis challenging regardless of the incidence.
We attributed the lack of correlation between the software evaluation and other measurements to the differences in light incidence and values from each processed or evaluated unit. While the FaceTag software scores refer to fixed points and their correlations with each other, FACE-Q assesses and scores symmetry and other variables, such as age perception or volume distribution balance on the face. This difference in the weight of the value from these variables probably impacted the statistical difference between the quantitative scores from FACE-Q translated into Rasch tables and FaceTag.
Assessment with literature-validated volumization software requires technologies with a hardware infrastructure to obtain data from the patient at the office. We selected the Crisalix software for the present study because it needs only three incidences for the 3D reconstruction of the patient to calculate volumetric differences in each region. As such, it applies to previous photographic registration, lowering costs.
Although the processing is more practical and accessible, the volumization values obtained by the software presented no correlation between positive and negative areas. In addition to the lack of correlation between the values, the areas of facial demarcation for volumetric evaluation, although well defined, are not the same areas classically assessed in a subjective way neither by the patient nor by the expert plastic surgeon to check the subject’s youthfulness, being useful for analyzing volumetric symmetrization alone.13–16
Conclusion
In our sample, there was no correlation between quantitative and qualitative variables from the different methods under evaluation. Therefore, further studies and adaptations are necessary to understand better the relationship between each method and the actual determination of surgical success.
REFERENCES
1. Larson DL. An historical glimpse of the evolution of rhytidectomy. Clin Plast Surg 1995;22(02):207–212. Doi: 10.1016/S0094-1298 (20)30962-7
3. Wei B, Duan R, Xie F, Gu J, Liu C, Gao B. Advances in Face-Lift Surgical Techniques: 2016-2021. Aesthetic Plast Surg 2023;47 (02):622–630. Doi: 10.1007/s00266-022-03017-z PubMed
4. Harrar H, Myers S, Ghanem AM. Art or Science? An EvidenceBased Approach to Human Facial Beauty a Quantitative Analysis Towards an Informed Clinical Aesthetic Practice. Aesthetic Plast Surg 2018;42(01):137–146. Doi: 10.1007/s00266-017-1032-7
5. Pietruski P, Majak M, Antoszewski B. Clinically Oriented Software for Facial Symmetry, Morphology, and Aesthetic Analysis. Aesthet Surg J 2017;38(01):NP19–NP22. Doi: 10.1093/asj/sjx163
6. Dyer C. Clinical negligence claims against plastic surgeons rise “significantly”. BMJ 2012;344:e298. Doi: 10.1136/bmj.e298
7. Ifeacho SN, Pothier DD. A comparative analysis of the litigation rate against the NHS following rhinoplasty by otorhinolaryngologists and plastic surgeons. Clin Otolaryngol 2009;34(02): 177–178. Doi: 10.1111/j.1749-4486.2009.01893.x
8. Surek CC, Moorefield A. Deep Plane Anatomy for the Facelift Surgeon: A Comprehensive Three-Dimensional Journey. Facial Plast Surg Clin North Am 2022;30(02):205–214. Doi: 10.1016/j. fsc.2022.01.015
9. Sheng L, Yu Z, Li S, Jiang Z, Cao W. Midface Rejuvenation With Autologous Fat Grafting. J Craniofac Surg 2023;34(02):633–638. Doi: 10.1097/SCS.0000000000008949
10. Mailey B, Baker JL, Hosseini A, Collins J, Suliman A, Wallace AM, Cohen SR. Evaluation of Facial Volume Changes after Rejuvenation Surgery Using a 3-Dimensional Camera. Aesthet Surg J 2016;36 (04):379–387. Doi: 10.1093/asj/sjv226
11. Weinkle SH, Werschler WP, Teller CF, Sykes JM, Shamban A, Rivkin A, et al. Impact of Comprehensive, Minimally Invasive, Multimodal Aesthetic Treatment on Satisfaction With Facial Appearance: The HARMONY Study. Aesthet Surg J 2018;38(05):540–556. Doi: 10.1093/asj/sjx179
12. Kucukguven A, Galandarova A, Bitik O. A Systematic Review and Meta-Analysis of Early Relapse After Facelift. Aesthetic Plast Surg 2023;47(01):144–155. Doi: 10.1007/s00266-022-02894-8
13. Sasaki GH. The Safety and Efficacy of Cell-Assisted Fat Grafting to Traditional Fat Grafting in the Anterior Mid-Face: An Indirect Assessment by 3D Imaging. Aesthetic Plast Surg 2015;39(06): 833–846. Doi: 10.1007/s00266-015-0533-5
14. Meier JD, Glasgold RA, Glasgold MJ. 3D photography in the objective analysis of volume augmentation including fat augmentation and dermal fillers. Facial Plast Surg Clin North Am 2011;19 (04):725–735, ix. Doi: 10.1016/j.fsc.2011.07.012
15. Fitzgerald R, Graivier MH, Kane M, Lorenc ZP, Vleggaar D, Werschler WP, Kenkel JM. Facial aesthetic analysis. Aesthet Surg J 2010;30:25S–27S. Doi: 10.1177/1090820 × 10373360
16. Bueller H. Ideal Facial Relationships and Goals. Facial Plast Surg 2018;34(05):458–465. Doi: 10.1055/s-0038-1669401
17. Kaya KS, Türk B, Cankaya M, Seyhun N, Coşkun BU. Assessment of facial analysis measurements by golden proportion. Braz J Otorhinolaryngol 2019;85(04):494–501. Doi: 10.1016/j.bjorl.2018.07.009
1. Hospital Federal dos Servidores do Estado, Rio de Janeiro, RJ, Brazil
Address for correspondence Gabriel Neves dos Santos Mosqueira Gomes, MD, Hospital Federal dos Servidores do Estado, Rua Sacadura Cabral, 178, Saúde, Rio de Janeiro, RJ, 20221-161, Brazil (e-mail: gabrielmosqueira@live.com).
Article received: July 23, 2024.
Article accepted: March 20, 2025.
Conflict of Interests
The authors have no conflict of interests to declare.
 Read in Portuguese
 Read in English
 PDF PT
 Print
Print
 Send this article by email
 How to Cite
 Mendeley
 Pocket